Tasmania —
A Cash Flow Analysis
Based on a Working Paper commissioned by Ruth Forrest MLC and a presentation
to the Economics Society, Hobart, 22nd March 2012.
The aim of this
paper is an assessment of Tasmania’s past, current and forecast financial
position, over a 9 year period, from 2006/07 to 2014/15. In particular this
will include a close look at the General Government Sector’s (GGS) Cash Flow
Statements to
• Reclassify inflows and outflows into more
appropriate categories of ‘operating’, ‘investing’ and ‘financing’ as will
allow an easier interpretation of Government financial statements.
• Examine the components of each category of
inflow and outflow.
• Examine the source of inflows as Federal vs
State sourced revenue.
• Provide a basis for understanding and
measuring sustainability.
The General Government includes all
departments and agencies but not its subsidiaries, the GBE and State Owned
Corporations SOCs, which together with the GGS form the Total State Sector.
In simple terms, accrual accounting standards lead to 3 major financial statements for any accounting period: an Income (or P&L) Statement, a Statement of Financial Position (or Balance Sheet) and a Cash Flow Statement.
In simple terms, accrual accounting standards lead to 3 major financial statements for any accounting period: an Income (or P&L) Statement, a Statement of Financial Position (or Balance Sheet) and a Cash Flow Statement.
A Cash Flow Statement is the best guide as to
where cash comes from and how it is spent. It includes all receipts and
outlays, split between ‘operating’ flows which are mostly allocated to the
P&L and ‘investing’ and ‘financing’ flows which end up on the Balance
Sheet. Non cash amounts (eg depreciation) and accruals (amounts incurred but
not paid) are added to finalise a P&L and a Balance Sheet.
A P&L looks like this:

The non-cash ‘depreciation’ amount is readily
identifiable but the accrual amounts, principally the costs of unfunded defined
benefit (DB) superannuation are harder to locate.
The following table lists the accrued DB
superannuation amounts included in the P&L for the last 2 years. The
‘employer service cost’ is included in ‘superannuation’, ‘nominal
superannuation interest’ included as such and ‘accrual(gains)/losses’ included
as ‘movements in super liability’. All have been accrued; none have been paid
in cash. These amounts are shown at the foot of the table.

The cash amounts paid aren’t included in the
P&L as they simply reduce a liability accrued from a prior period. Instead
they are allocated to the Balance Sheet to reduce the unfunded superannuation
liability.
The operating profit figure or net operating
balance (NOB) as the GGS calls it is used to measure Budget sustainability, one
of the Government’s key fiscal strategies.
One problem with NOB as a measure of
sustainability has been that the capital stimulus grants from the Federal
Government (the Nation Building Grants) are included as income in the NOB
calculation although the ensuing capital outflow is not. This overstates
operating profits.
To allow for this the Government calculates an
Underlying NOB.
Nevertheless in her media release that
accompanied the recent Mid Years Report, the Treasurer referred to the
estimated NOB deficit of $246 million for this year rather than the underlying
NOB deficit of $387 million.
The NOB being a profit measure doesn’t include
amounts spent on capital items, so there’s a measure called the Fiscal Balance,
which essentially replaces the non cash depreciation amount in NOB with the net
expenditure on capital (in cash).
The Fiscal Balance is perhaps the most
accurate current measure of sustainability. It includes accrued expenses and
also capital outlays. In 2007/08 the Fiscal Surplus was $102 million and the
2008/09 Budget projected surpluses in each year of the Forward Estimates. In
the latest Forward Estimates the Fiscal Balance remains negative in each year,
in aggregate worsening by an alarming $318 million in the latest Mid Year
Financial Report. There was no mention of this in the Treasurer’s media
release.
The GGS is essentially a cash business and as
the Cash Flow Statement contains all inflows and outflows, not just operating
flows, it arguably is a better basis than NOB for beginning to understand the
sustainability and the operations of the GGS.
Having a surplus NOB suggests sustainability but
certainly doesn’t guarantee it. Businesses can appear profitable, with positive
profits, but they can be cash flow negative and non viable. The converse could
also be true. In the case of the General Government, surplus NOBs can disguise
negative cash flows because, for instance, of the extra needed for ’investing’
and ‘financing.’
Similarly having a Fiscal Surplus doesn’t
guarantee sustainability or viability either. ‘Investing‘ activities may suffer
in order to maintain a Fiscal Surplus, and this may have long term consequences
for the State with inadequate infrastructure for instance.
Continuing Fiscal Deficits will almost
certainly lead to an increase in financial liabilities as accrued expenses are
capitalised.
If and when Fiscal Surpluses (and NOB
surpluses for that matter) finally emerge it’s possible they will coincide with
cash deficits, when previously accrued or capitalised expenses are eventually
paid.
The above highlights the budgetary problems
confronting the State and the need for caution when using measures of
sustainability. The Government has acknowledged problems with too many measures
of sustainability and the latest Fiscal Strategy includes only one, the NOB,
with the aim of reducing “confusion and the potential to deliver mixed messages
about actual financial performance”.
To achieve an enhanced understanding of
sustainability a closer look at the components of inflows and outflows of
Government is needed and the best place to start is the Government’s Cash Flow
Statements.
The Auditor General (AG) in the last 2 years
has reported to Parliament a Cash Flow Statement, in a form contrary to the
strict Uniform Reporting requirements of Governments, but which reallocates
capital grants from the Australian Government as ‘investing’ cash inflows not
‘operating ‘ cash flows. The Cash Flow Statement reveals total cash received
and spent each year.
The following is an abridged form of the AG’s
cash flow statement.

The numbers aren’t important at this stage,
it’s only intended to show the format of a cash flow statement, split into
operating, investing and financing cash flows and the components within each
category.
This paper will adopt the AG’s approach and
extend it a little further by reclassifying payment of benefits to retired
members of the State’s unfunded superannuation scheme as ‘financing’ outflows
rather than ‘operating’, because (notwithstanding literal interpretations of
accounting standards) that is what they are; they are a reduction in a liability
not an operating outflow in respect of current employees. The aim is to get a
more pragmatic classification of ‘operating’, ‘investing’ and ‘financing’ cash
flows.
How has the GFC affected the State’s cash
inflow? The blip in 2008 was, as we shall soon see, due to the Hobart Airport
sale. The peak was reached in 2011 with a flat line thereafter. Having endured
relentless descriptions of plummeting post GFC inflows, the total actual
inflows are surprisingly benign.

Let’s have a closer look at the components of
the cash flow, operating and investing. There is no inflow from financing
because no money has, or will be borrowed. Operating revenue includes general
and specific purpose grants from the Feds but not capital grants, and all our
own State source revenue, taxation, dividends from GBE/SOCs etc.
The operating revenue is relatively stable
showing modest increases over time. It’s the investing income that has provided
the volatility.

The steadily increasing operating inflows will
no doubt beg the question, how come we’re in so much trouble? Answer: The
operating outflows increased much faster as we shall soon see.
But first the rest of the inflows.
What comprises the investing income? 3 Items:
• Commonwealth Nation Building Grants
• Sale of non-financial assets such land buildings etc.
• Equity disposals, the Hobart Airport in 2008 and TOTE in 2012
• Sale of non-financial assets such land buildings etc.
• Equity disposals, the Hobart Airport in 2008 and TOTE in 2012

How has total State Government cash inflow been split between the contributions from the Australian Government and from our own sources?

The State’s share is simply the inverse of the Feds’ share. Over the last 4 years the State’s share has fallen as low as 36% but will climb back to 43% by 2015 mainly due to the withdrawal of the Nation Building funding. During the GFC and its immediate aftermath we relied on the Feds to bail us out. The general purpose grants via GST were less than expected but the Feds more than matched the falls with special purpose grants. Our own source cash fell. We can keep blaming the fall in Fed receipts for the cause of our current woes, but the simple fact is that it’s our own source cash that has lagged, not the Fed grants.

What are the components of State source
operating cash? Taxation makes up the majority fluctuating between 45% and 49%.
What comprises the remainder of State sourced revenue? Sales of goods and
services and returns from GBEs etc have both been cranked up in the 2012 to
offset reduced revenue from state taxation and interest.

What comprises State taxes? The largest contributor payroll tax is holding up with an increasing share of State taxes from 30% in 2008 to 34% in 2015. Over the same period duties will fall from 24% to 15%, a catastrophic fall. Other taxes have picked up the slack.

Of the ‘other taxes’ MV fees & registrations has steadily increased its % share and guarantee fees from GBEs/SOCs have been significantly raised whilst the remainder are stable in % terms or falling in the case of gambling receipts.

Now for the cash outflows. How has the pattern of cash outflows changed? It peaked in 2011 and the next 4 years will see small decreases. The Treasurer recently acknowledged excess spending in recent years, arguably represented by amounts above the black line.

But what are the components of the cash outflow, split between operating, investing and financing? The features to note are the rapidly increasing operating outflows which peaked in 2011 before pausing , declining then gradually increasing. Extra volatility is provided by changes to ‘investing’, mainly spending the Nation Building monies.

The increases and projected increases in operating outflows have slowed considerably since 2010 (the blue line). Had they continued the same trajectory as the years 2008 to 2010 it would have looked like this (the red line).

What is the breakup of operating expenses? In
% terms the components are quite stable. They may well move together. It’s
difficult to draw too many other conclusions from this limited data, whether
the % spent on wages is too high?

One salient observation from the above table is that the super expense is low. Given the level of employee entitlements it should be closer to 5% not 3%. This is because the costs of superannuation (the red Line) doesn’t include defined benefit DB members as the contributions are not set aside with cash. The cost of DB super accrued in the P&L statement (excluding actuarial movements) but not paid in cash plus the actual payments made in cash for retired members is shown in the next chart.

When pension and lump sum benefits are paid the Government includes them as operating outflows. Arguably, and this is what been done for the purposes of this paper, the outlays are ‘financing ‘ outflows because in effect what is occurring is a reduction in a liability incurred in a prior period, the unfunded superannuation liability, rather than an ‘operating’ outflow.
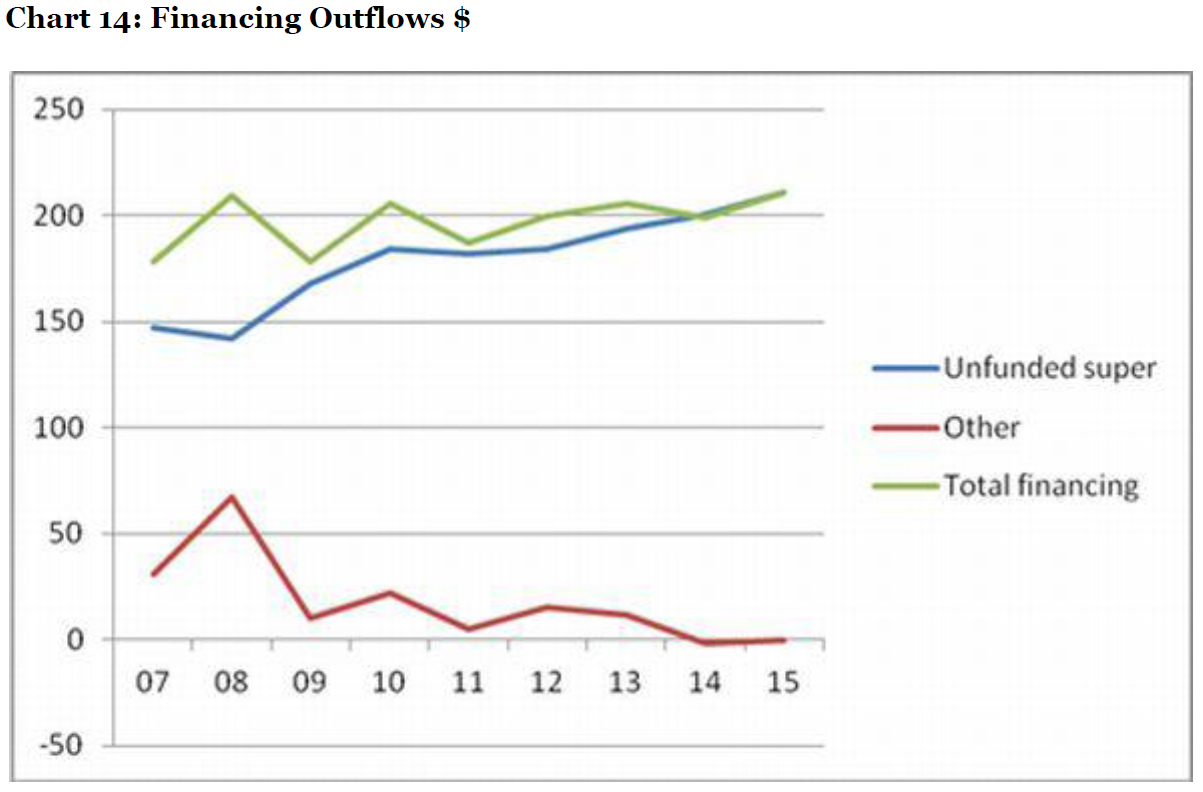
The ‘financing’ outflows are shown in the
following table. The red line shows repayments of the small amount of State
Government debt owing. The payments in regard to unfunded superannuation (the
pension and lump sum payment) are added to give the net outflow from financing
(green line).
What about investing outflows? The chart gives
the details, an increase up till 2011 followed by a decrease.

What is the breakup of investing outflows? The
majority is represented by purchases of non financial assets such as roads,
buildings infrastructure, plant and equipment. The remainder comprises equity
injections into GBEs and SOCs.

One of the Government’s fiscal strategies is to spend as much on new roads, buildings, plant etc as the existing ones are wearing out. In other words to ensure that the outlays exceed depreciation.
The following graph indicates that by 2015 outlays
will once again revert to the same as depreciation, similar to 2008. The
intervening years saw the years of Nation Building and additional
infrastructure outlays by the State Government. In real terms the outflow in
2015 is similar to 2008 (using CPI as a deflator).

Putting together the total inflows and outflows how does the cash balance track? The final year 2015 sees inflows exceeding outflows for the first time since 2008. It takes a long time to change course. This may be as much a reflection on the inertia of the system as any tardiness by policy makers—Newton’s First Law of Motion as it applies to Government finances.

The following graph shows the decline in cash (the blue bits). By 2015 the State will have only $333 million in cash. The cash balances can be a little misleading as the costs of superannuation for defined benefit DB members are not set aside in cash. Were the employer costs of DB super set aside each year (excluding interest on the unfunded amount) the cash balance would have been considerably worse, as shown by the red bits. Even if it were assumed that all employees were defined contribution employees requiring 9% of salaries to be set aside each month the result still shows declining cash balances becoming negative over the period of the Forward Estimates. This suggests the current structure is still flawed.

The Treasurer claims we are net debt free as
the blue bits in the following chart remain above zero. The unfunded
superannuation liability requires payment on a regular basis and forms part of
net financial liabilities (net debt plus the unfunded super liability).
The result, the red bits, in the following chart represents the Government’s net financial liability. Our liabilities are growing. The graph below tells the tale.
The result, the red bits, in the following chart represents the Government’s net financial liability. Our liabilities are growing. The graph below tells the tale.

Given stoic acceptance of flat line cash inflows (in nominal terms, worse in real terms), the following graph crystallises the State’s challenges on the spending side; falling total cash outlays, almost flat line operating outlays, declining investing outlays which will soon be exceeded by financing outlays.

Sustainable cash flow management arguably requires net operating cash flows to be sufficient to cover net investing and financing outflows. The latter are shown in the next chart.

The following chart shows net operating cash flows finally exceeding net flows from ‘investing’ and ‘financing’ in 2015. Sustainable?

The projections in 2015 may indicate sustainability as we finally achieve positive cash flow. However, it will need to be repeated for a good few years thereafter. But does it imply viability? A few observations:
• The forward estimates aren’t subject to
audit scrutiny. How accurate are they? In the past there have been significant
differences between forward estimates and actuals that finally eventuate. The
Government never tells us the assumptions used for future projections. They’re
simply handed down on a tablet as if from above. A cynic may be tempted to
suggest that it would be a foolish Government to produce a set a forward
estimates that didn’t contain a glimmer of light at the end of the tunnel. The
latest Mid Year Report shows negative NOBs and Fiscal Balances all the way
through the Forward Estimates but just a sliver of light from a positive Cash
outcome in the final year. A precarious projection.
• How will ‘financing’ outlays move? Currently
they represent about 4% of cash outlays. Indications are as all DB members
retire in the next 20 years it may reach 6% to 7% of outlays. Thereafter the % will
gradually reduce to zero over a 35 year period as Members expire. (To sidetrack
a little, this suggests that we are in no way similar to Greece. The financing
liability is not a debt that has to repaid or rolled over at the end of a
certain term, and the costs to service whilst significant in $ terms, represent
only a small portion of total cash outlays).
• Are ‘investing’ outlays of 5% of cash
outlays in 2015 sufficient for our needs? Or will this % need to increase to
keep renewing and replacing buildings roads and infrastructure? The question of
GGS expenditure for ‘investing’ activities needs to be seen in the context of
all such expenditure amongst Governments, including that by the GBEs/SOCs and
local Government, because there will be varying economic and social impacts
depending on the type, an irrigation scheme vs a cycle path for instance, and a
coordinated approach will ensure a better outcome for each $ spent.
• Will the remaining funds for ‘operating’ be
enough to provide required Government services given flatline receipts?
The State’s dilemma is further compounded by
the fact that:
• Much of what has been appropriated into the
Special Deposit and Trust Fund (SDTF) in the Public Account has been
‘internally borrowed’ and spent.
• The majority of cash remaining belongs to an
account in SDTF termed Australian Government Funds Management Account which
contains Australian Government specific purpose grants awaiting expenditure. It
is not available to be spent on the State’s general purpose needs.
The Auditor General highlighted the problem in
his presentation to MPs in November 2011. The vertical columns represent what’s
been appropriated to SDTF, the majority being the straw (?) coloured portions
taken as hay from the barn, to paraphrase the Treasurer, or more accurately the
‘internal borrowings’ with the blue portions representing the remaining cash.
The red line is the untied cash, only $196 million at 30th June 2011.

Another interpretation of the above chart is
that Parliament has appropriated amounts to SDTF far in excess of the amount of
cash available, a puzzling approach likely to change if ever the Government
completes its review of the State’s Financial Management framework. The
difference between amounts appropriated to SDTF yet to be spent and the amount
of available cash is represented by the Temporary Debt Repayment Account which
indicates what has been ‘internally borrowed’.
The Government defence of the level of
‘internal borrowings’ was invariably to cite prudence. It would be imprudent to
borrow externally when internal funds are available. Quite true, especially
since repayments arrangements are very flexible, in recent years, non existent.
But the question should really be, why continue to appropriate funds into a
SDTF account as is happening with the Superannuation Provision Account (SPA) if
there’s no cash available? You don’t understand is the latest defence line,
it’s just a provision. A provision for what? A provision to provide for the
extinguishment of a provision (unfunded liability)? How about another provision
to reflect impairment, a provision for the estimated cash shortfall in regard
to SPA, just to turn add another layer of farce? Maybe not. That may be a de
facto acknowledgement that 100% cash backing for SPA is no longer possible
which implies that an account in SDTF may have been used for purposes other
than what it was intended, contrary to Sec 13 of the Public Account Act 1986?
The Government keeps topping up SPA with
further appropriations when there’s no cash, ostensibly with the aim of
eventually extinguishing the unfunded liability by 2035. But is there any point
if by 2035 the balance of SPA is simply represented by an equivalent sized
Temporary Debt Repayment Account representing all the ‘internal borrowings’?
On present indications that is what is likely
to happen, although the Government still refers to “short term issues with cash
backing”. The SPA account as set out in Budget Paper No 1 comes with the
explanation that “there are sufficient receipts from agencies, the Reserved by
Law contribution and from interest on the SPA balance to meet the emerging
costs” which leaves one with the distinct impression that we are dealing with
cash amounts. This is not the case. They are just appropriations. Even the interest
credited to SPA ($81 million expected in 2012) is an appropriation, a book
entry, not interest earnings per se as is generally understood by most readers.
The actual expected interest to be earned by the total GGS is only $23 million
for 2012.
Maybe it would be preferable to admit to the
improbability if not impossibility of the task of trying to extinguish the
unfunded liability by a certain date, thereby reducing the misunderstanding in
the community, and treat payments for DB pension and lump sums, in a more
transparent and realistic manner as ‘financing’ outflows which reduces a
financial liability, as has been done for the purpose of this paper.
Most of the confusion surrounding the system
of internal borrowings and cash backing stems from the dual fund Public
Account: a Consolidated Fund and the Special Deposits and Trust Fund. The
former is where most amounts are first received. Funds are then spent as
Reserved by Law amounts or amounts appropriated by Parliament. Parliament will
also appropriate amounts to top up balances in SDTF which consists of various
working accounts, deposits and trust funds. The problem now is, as highlighted
in the previous chart, is that for every $4 that has been appropriated by
Parliament there is only $1 in cash available. If one excludes the specific
purpose grants from the Australian Government the figure is $1 cash for every
$10 appropriated. The ‘missing’ funds from the Public Account are reflected in
the Temporary Debt Repayment Account. The opening balance of this account when
the old cash accounting system was replaced with the more standard accruals
system about 10 years ago was $700 million represented by maturing debt that
had been repaid by sensibly using cash balances in other accounts, in other
words by ‘internal borrowings’. But it has been the last few years particularly
2011 which has seen such a massive blow out in ‘internal borrowings’, none of
which relate to repaying maturing debt but rather to helping fund the ordinary
operations of Government. The dual Fund Public Account system is looking a
trifle anachronistic. Maybe it’s time to go to a single Fund system as proposed
by Treasury some 2 years ago, and start confining appropriations to available
cash, which incidentally will include cash from borrowings if ever that happens
in the future, and which may be understandable by a wider number of
stakeholders.
In summary the State’s current situation
manifests as follows:
• Flat line cash inflows in nominal terms,
worse in real terms.
• A reluctance to address the matter of
reduced inflows.
• Flat line ‘operating’ cash outflows.
• Falling ‘investing’ outflows, to such an
extent that expenditure on new capital will barely cover impairment of existing
capital by the end of the forward estimates period.
• A small but inexorably growing ‘financing’
cost of unfunded superannuation which will soon equal amounts spent on
‘investing’, on new capital in other words.
• A maintenance of the fiction of ‘net debt
free status’ when our financial liabilities are still increasing.
• A growing reliance on cash in advance from
Federal specific purpose grants to finance the general operations of
Government.
• The borrowing and spending of amounts
appropriated to SDTF without any reasonable chance of repayment.
• An absence of any realistic measures to
assess the long term viability of the State.
All measures of sustainability—-underlying
NOB, Fiscal Balance and even Cash Balances can be misleading from time to time,
so it is important to understand the components that affect the measures. Cash
Flow Statements gives a realistic view of the operations of Government. Most
people understand cash inflows and outflows. The different activities of
‘operating’, ‘investing’ and ‘financial’ when explained are not difficult to
grasp.
To date there has been a conspicuous failure
by Government to give an adequate and coherent explanation of our budgetary
problems. To its credit the Opposition prepared an ‘alternative’ Budget this
year, but that too didn’t appear to grasp the problems ahead and the tinkering
suggested would have negligible effect (if any) on the State’s battle to find a
sustainable path.
A greater understanding is a prerequisite for
moving forward. A little more collaboration across the spectrum would assist.
Arguably for a start, ‘financing’ outflows and targets for net ‘investing’
outflows need to be tabled for all to understand and then ‘operating’ flows
designed to cover both with a cash buffer for a rainy day.
We certainly can’t rule out a few of the
latter.
Postscript
The Secretary of the Federal Treasury Martin
Parkinson recently gave a speech http://www.treasury.gov.au/documents/2340/PDF/AICC_charts_final.pdf in which he made a few points pertinent to the above
discussion.
He said ”.... the task of maintaining
medium-term sustainability for both the Commonwealth and the States has been
made harder by developments in the revenue base. Indeed, for both levels of
government, surpluses are likely to remain at best razor-thin without
deliberate efforts to significantly increase revenue or reduce expenditure.
This predominantly reflects the sharp
weakening of revenue collections over recent years.
the task of maintaining medium-term
sustainability for both the Commonwealth and the States has been made harder by
developments in the revenue base. Indeed, for both levels of government,
surpluses are likely to remain at best razor-thin without deliberate efforts to
significantly increase revenue or reduce expenditure.
This predominantly reflects the sharp
weakening of revenue collections over recent years.
The tax-to-GDP ratio has fallen by 4
percentage points since the GFC, and is not expected to recover to its
pre-crisis level for many years to come. This reflects a combination of
cyclical and structural factors”.
Endnotes
1. The focus on the cash flow statement in no
way is intended to imply that the old cash system of reporting by Governments
is superior to the accruals system. The accruals system is fundamental to
reporting on the stewardship of public assets and liabilities. Nor is it
implied that the cash flow statement should be the sole guide for public policy
makers. It is recognised that financial statements as produced by Governments
are predominantly to satisfy is statutory obligations. The intent of the paper
is to adapt the cash flow statement to provide an easier and more meaningful
interpretation of financial statements for lay users. Tasmania raises less of its
own revenue than other States and is more of a ‘price taker’. It is basically a
small service provider. It doesn’t have huge service responsibilities as the
Australian Government does with defence and social security, for example. It
has an extremely limited fiscal role (if any) and a limited ability to borrow
to fund deficits. An examination of its cash flows provides the best way of
diagnosing its financial health. Profitability and rates of return on assets
are not of paramount importance in the public sector being immaterial compared
to sustainable and viable cash flows.
2. Sustainability is not defined by the
Government. The common usage definition is assumed. Viability is assumed to be
a subset of sustainability, with higher benchmarks. In both cases the precise
definitions are not crucial for the purposes of the paper.
3. The inclusions of equity disposals as own
source revenue is not intended to endorse such disposals as a means of
achieving sustainability. Any discussion about sustainable cash flows should
obviously exclude the one off boosts provided by equity disposals.
Data Sources
Treasurer’s Annual Financial Reports, 2007/08,
2008/09, 2009/10 and 2010/11.
Analysis of the Treasurer’s Annual Financial Report 2010/11, Report of the Auditor General.
Tasmanian Budgets 2011/12 and 2008/09, Budget Paper No.1.
2011/12 Mid Year Financial Report.
Hansard, Legislative Council, Answer to Question Upon Notice, 21st Nov 2011.
Analysis of the Treasurer’s Annual Financial Report 2010/11, Report of the Auditor General.
Tasmanian Budgets 2011/12 and 2008/09, Budget Paper No.1.
2011/12 Mid Year Financial Report.
Hansard, Legislative Council, Answer to Question Upon Notice, 21st Nov 2011.
No comments:
Post a Comment